Why we mirrored every TMK in Hawaiʻi as TypeScript
We built a complete, queryable map of every parcel, building footprint, and address in the islands — 56 million lines of typed public-record data. Here's why a Honolulu software studio writes its own GIS layer instead of renting one.
Every contractor in Hawaiʻi has had this moment. A client mentions an address. You reach for an old printed plat. Or you click through three government websites trying to find the TMK. Or you punch the address into someone’s SaaS and it asks for a credit card before it tells you the lot size.
We got tired of it. So over a long weekend, we mirrored the entire public-record map of Hawaiʻi into a single TypeScript codebase — every parcel statewide, every building footprint on Oʻahu, every street address. The result lives at maps.ikenagroup.com and is open to anyone.
The numbers
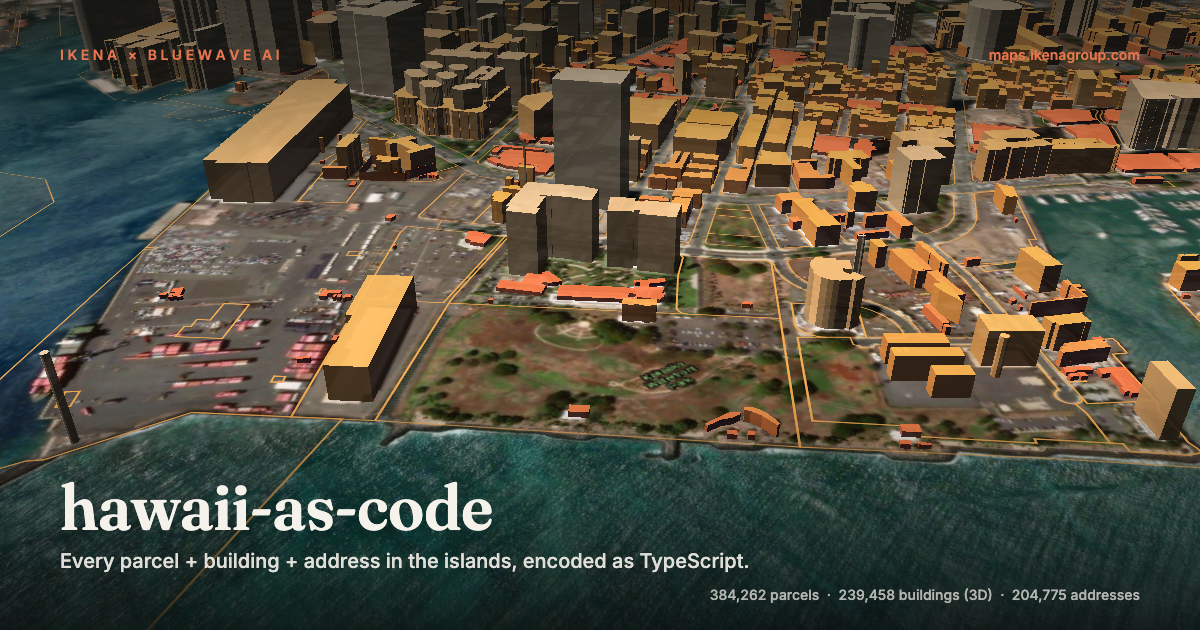
- 384,262 statewide TMK parcels with full polygon geometry, computed area, perimeter, and a deep-link to qPublic.
- 239,458 Honolulu building footprints with real heights (max + base elevation, NGA cross-reference, owner, structure name).
- 204,775 Honolulu address points with TMK, ZIP+4, census tract, geocoded display address.
- 829,361 generated TypeScript files.
- 56,231,679 lines of code.
Sources: the Hawaiʻi Statewide GIS Program and the Honolulu open data hub. Public records, made queryable.
What we built on top
The map at maps.ikenagroup.com is built with MapLibre GL on the front end and a tiny zero-dependency Node server on the back. Four basemaps: dark, light, voyager, satellite. Five toggleable layers: parcels, 3D buildings (auto-tilts to 60° pitch and extrudes every Honolulu structure to its real height), addresses, streets, and live NEXRAD weather radar.
Tools: a measure tool with distance and area, an export-as-PNG button, a fly-through tour of six island highlights, and a voice-control button that listens for “go to Diamond Head” or “Pearl Harbor” and flies you there. A live Waikiki ocean report at the bottom of the sidebar pulls the current tide from NOAA Honolulu Hbr and the wave height + period + direction from NDBC buoy 51202 at Mokapu Point. Bookmarks save to your browser. The URL syncs to the view, so any framing is shareable by link.
Why we built it ourselves
Three reasons.
First, the data was already public. The State of Hawaiʻi pays staff to maintain this data. The City and County of Honolulu maintains it again. The U.S. Census, the USPS, NOAA — all of them publish their feeds for free. Renting access through a property-data SaaS or a permit-data startup just means paying a third party to download what is already yours.
Second, the data layer is the moat. Every other tool we ship — the iOS scanning app, the project portal, the change-order generator, the contractor SaaS — has to know what address you’re standing on, what zone it sits in, who owns the parcel next door. If we rented that layer, we would be one API price-hike or one acquisition away from being broken. We don’t want to be in that position with a real client’s project on the line.
Third, the work is small once the data is local. Once every parcel is a TypeScript file, looking up a property is a static import. Computing the area of a lot is a function call. Drawing a 3D building over satellite imagery is a paint expression instead of a procurement cycle. The map you can browse today was built in three nights, because the data was already on disk and waited to be addressed.
What it costs us
The whole thing runs on the same Vultr instance that serves our other tools. The data refresh is a polite, resumable scrape against the source ArcGIS endpoints — the parcels take about ten minutes quarterly. The repository is one private GitHub repo. There is no recurring cost. There is no per-user fee. There is no SaaS to renew.
We open-sourced the “mirror” pattern because the public records are public. The source is at github.com/portofcams/hawaii-as-code if you want to do this for another state. Connecticut, Vermont, and Alaska all publish similar feeds; the same pattern would work in a weekend.
Try it
Open the map and try the voice button: “go to Diamond Head.” Or type your address into the search bar — if you’re in Honolulu, the autocomplete is reading from all 204,775 of them. Or click any building in downtown to see its real height. Or watch the tide come in at the bottom of the sidebar — that’s NOAA, live.
We use this every day. We hope someone else does too.
Ikena Design & Build is a software studio in Honolulu, Hawaiʻi. We design and build AI-native web products for the trades, real estate, and the people who keep everything moving. Mālama — care for the work and the place.
Building Hawaii Insurability Brief: A Free Property Hazard Lookup for Hawaii Homeowners
A builder's account of why we built a free 10-field hazard lookup for Hawaii properties — lava zone, FEMA flood, tsunami, coastline distance, hurricane wind, wildfire risk, BFE, shoreline management area, roof age, and carrier availability — and how the freemium model works.
Building AI-native products on Claude: a Honolulu studio's playbook
Six products live, all built against the Anthropic Claude API. Here's how we structure AI calls in production, what we cache and what we don't, how we keep latency under 2 seconds for user-facing flows, and the patterns that have actually shipped — not the hype.
Hawaii GET tax on SaaS subscriptions: a practical guide
Hawaii taxes SaaS revenue differently than most US states — and very few founders know the rules until their first G-45 return is overdue. Here's how Hawaii's General Excise Tax actually works for subscription software businesses, with the rates, the forms, and the traps.